


Tensile test ISO 6892 - Knowledge
Metal tensile test Tensile strength Elongation ...
Everything, absolutely everything that is manufactured must (should) be tested so that the material or the product made from it can fulfil its intended purpose. This could be the tab of a drinks can that tears off without the can being opened, or a bridge that collapses because the steel used was defective. This principle applies to all materials: plastics, adhesives, glass and above all metals, because as soon as a product has to withstand forces, metal is usually the material that best fulfils this task.


The requirements for metals are very different, sometimes extreme. Metals for steel springs must be extremely strong / hard (high tensile strength) and yet elastic / resilient (elastic elongation). On the other hand, the production of cooking pots, for example, requires a flat sheet metal blank to be extremely deformed (deep drawing = material deformation or plastic elongation) without thinning or cracking.
In order to exclude production-related quality fluctuations, intermediate metal products are regularly tested by means of a tensile test on a tensile testing machine. The rods, tubes and sheets require the production of different tensile specimens with cylinder head, threaded head or sheet metal flat specimen.
The most important mechanical material parameters of the tensile test on metal are
* Modulus of elasticity / Hooke's straight line
* Yield strength ReH / yield strength Rp0.2
* Tensile strength Rm
* Uniform elongation at break A5.65/A80
* Constriction Z
Tensile specimens with threaded head

Flat sample hot rolled strip

Examination procedure
The tensile test according to ISO 6892 is classically performed in three phases:
1. Extension of the tensile specimen at low speed in the elastic range
Elastic, reversible strain
2. constant creep rate between elastic and plastic strain
First damage: yield strength ReH / yield point Rp0.2
3. significant increase in speed in the plastic range until fracture
Irreversible, plastic strain
ISO6892 required for a tensile test:
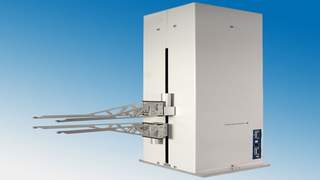
Tensile testing machine
Klasse 1 ISO7500

Tensile testing machine 100 kN
Testing software
Metallzugversuch

Tensile Test Certificate
Extensometer
Class 1 according ISO9513
Extensometer MFX
Clamping fixtures
depending on the sample form

fixtures threaded heads
Schematic diagram of tensile test

What happens at the yield strength ReH?
Low or non-alloyed iron generally has a yield strength ReH. If it is stretched during the tensile test, a spontaneous yielding occurs at a force or at the stress to be determined. The most highly loaded force combinations of the "hooked" metal crystals slip and a clearly visible sagging of the force (of the graphene) occurs. Now other "Velcro hooks" allow the force to increase again until these also fail and slip. Once all the coarse bonds have slipped, the effect disappears and all the crystals are stretched and extended together until the sample breaks.

What is the purpose of the yield point Rp0.2?
If iron is alloyed (chromium, manganese, etc.), steel is produced. This results in a finer crystal structure. This and cold forming (rolling, hammering) or heat treatments suppress the Lüders effect.
Instead of the easily analysable yield strength ReH, the modulus of elasticity and the "equivalent yield strength" must be determined in parallel. For this purpose, the plastic yield strength Rp0.2% is analysed parallel to Hooke's straight line.

Tensile test - part of quality assurance


Today, materials can be produced in industry with a high degree of precision to the desired material quality. Nevertheless, the process of material production and further processing through to the finished end product (material - not component) must be constantly monitored, as a wide variety of factors can have a strong influence on quality. In the steel industry, for example, the composition of the alloy in the liquid phase of the pig iron / crude steel is almost the only criterion. Here, for example, spectral analysis is used to determine the various elements down to trace elements. During further processing, however, the material is sometimes extremely influenced by various processes. The properties of the material can be extremely altered by a wide variety of treatment methods. Here are just a few examples of processing methods:
- Rolling the steel to change the shape / thickness - Compaction of the material = higher tensile strength and hardness, lower ductility
- Hardening of the steel - Structural change = higher tensile strength and hardness, lower ductility, embrittlement
- Galvanisation - Material application = prevents rusting, chemical treatment in several steps can lead to embrittlement
- Intermediate annealing - Microstructure relaxes = tensile strength + hardness decrease, ductility increases, embrittlement decreases
- Blasting material (with steel ball, ceramic balls, sand) material removal (rust) / surface compaction = tensile strength / hardness at the surface increases
The material properties can change dramatically as a result of a number of further treatment and processing steps. However, if the design of a component or, for example, a bridge requires the use of a steel with a strength of 800 MPa, then it must also be checked that this requirement is met. Failure of the component must be ruled out (bridge construction, vehicle bodies, cranes and all assemblies and components that have to absorb static or dynamic loads).
Here are diagrams showing the difference between a yield point and a proof stress (left: diagrams with yield point / right: diagrams with proof stress)
Determination of material properties of metallic materials
")
There is no fundamentally "good" or "bad" metal, but the intended use / costs determine the requirements for the material. For example, a steel for a valve in an internal combustion engine must be extremely high-strength and hard to prevent premature wear. On the other hand, a sheet metal for a car mudguard must be relatively soft so that it can be formed without cracking / breaking the material (deep drawing process).
The material properties are determined, among other things, by testing a tensile specimen using a metal tensile test. These tests are most frequently carried out in the steel industry, plastics industry and rubber industry (and some more).
Depending on the type of use, the products (base materials) are processed in different geometries (tubes, bars, slabs, sheets and, of course, entire components). This means that a wide variety of sample shapes are required to determine the material characteristics. If the product has a large volume, a tensile specimen with a round cross-section is often produced from the solid material in the steel industry (lathe). Other products (e.g. sheet metal) require a flat tensile specimen with a square or rectangular cross-section to be produced and tested.
All measured values are related to a reference geometry so that the results can be compared with each other regardless of the cross-section. This is usually mm² for the strength or a reference length L0 (zero length - technical term: initial gauge length) for the elongation. For example, the tensile strength (abbreviation Rm) is shown in the unit N/mm² (Newton per mm²) or according to ISO 6892 in MPa (Mega-Pascal = conversion factor 1:1 to Newton mm²).
With a
plastic, for example, the tensile strength is 20 MPa (for illustration: ~ 2 kgf weight force per mm²)
soft sheet metal (car mudguard) at 200 MPa (for illustration: ~ 20 kgf weight force per mm²)
High-strength spring steel at 2,100 MPa (for illustration: ~ 210 kgf weight force per mm²)
In order to be able to evaluate this unit for the "normal citizen", the following should be said at this point for illustration:
1000 MPa corresponds to approx. 100 kgf weight force (approx. 101.93 kg - divisor 9.807)
If a square wire with a cross-section of 1 x 1 mm = 1 mm² is loaded with a force of 1000 Newton (based on 1 mm² = 1000 MPa) or 101.93 kg, it is stretched and breaks. The test specimen is clamped in a fixture and subjected to very slow, steadily increasing elongation. Today, the test is recorded electronically in the form of a diagram. With today's electronic evaluation systems, however, the diagram is only used for visual control and visualisation of the test process. The characteristic values are determined using complex algorithms. However, the diagram representation and the results should and must be approximately congruent in order to provide the user with a comparison between measured value <-> diagram to enable a visual assessment.
Basic information on the following diagrams
Characteristic data with R (stress values σ) characterise the force currently applied at this point divided by the initial cross-sectional area (S0) of the specimen - shown / "read off" on the vertical axis in the diagram.
Characteristic data with A (strain values ε) characterise the current elongation (strain) of the test specimen at this point in relation to an initial base (L0 - initial gauge length) - shown / "read off" on the horizontal axis of the graph in the diagram
The simplest form of explanation is usually visualisation by means of sketches. The following is a sketch of a yield strength material graph
Explanation of the material characteristics
- ReH - Upper yield strength
If the test specimen is subjected to further load, initial damage occurs: Force combinations in the material fail (simplified: fibres tear) and a spontaneous drop in force (or stress drop) occurs. This highest point on the straight line is known as ReH. After this initial damage, the sample elongates irreversibly - permanently elongated. The designer could load a material (component) up to the characteristic value ReH without causing permanent damage. Of course, the designer stays well away from this point for safety reasons.
- ReL - Lower yield point
After the first damage to the material has occurred (ReH), the force / stress (depending on the material) drops very significantly. This sometimes occurs at a significantly lower value than is usual for the Lüders strain. The first (very deep) drop in stress is called transient behaviour (extreme downward deflection of the curve directly after ReH). This deflection is not taken into account for the characteristic value ReL. In the following Lüders range, the lowest deflection of the graph is sought. This point is referred to as the lower yield point and is the point at which the stress drops to the maximum before a further steady increase in stress occurs.
- Hardening of the material (steady increase after Lüders expansion)
After all "problematic" force connections have been torn (Lüders expansion completed), the tension increases again and steadily. This can be explained as follows: Individual fibres in a rope were too short. These are now torn (Lüders behaviour). Now that all the "too short fibres" have broken, all the fibres of a rope take on the load again - the tension increases steadily again (without any other individual fibres breaking).
- Rm - Tensile strength
After the tension has continued to rise steadily, a state is reached in which no further increase in force is required to extend the tensile test: the material continues to stretch evenly until an (initially slight) necking (waist formation) of the test specimen begins at one point. The highest point of the force (stress) is determined and the tensile stress is calculated (maximum force through specimen cross-section = Rm in N/mm² or correct MPa). Once the maximum force has been exceeded, the sample begins to constrict at one point. This constriction now occurs faster and faster until the specimen breaks and is split in two.
- Lüders elongation Ae (not marked with a code letter in the diagram)
In the following part of the tensile test, these stress drops occur with varying frequency (depending on the material properties): an oscillation curve is created, which is known as Lüders strain after its discoverer. In the process, the crystals / force compounds slip past each other (drop in stress) and become entangled again (increase in stress). The easiest way to imagine this is like the individual fibres of a rope (more below).
- Elastic elongation (elongation of the sample to ReH)
- Plastic elongation (extension of the sample after ReH or after leaving the straight line)
As soon as the yield point ReH is exceeded or the straight line of elasticity is left, permanent plastic elongation begins. The specimen is permanently elongated and does not return to its original length even if the force is completely released.
- Elongation at break A
This is the permanent elongation that the sample undergoes until it breaks. As soon as the sample breaks, the elastic part contracts again and shortens the sample slightly (typically 0.3%).
- Total elongation at break At
This is the permanent elongation that the sample experiences up to break plus the elastic component. This elongation can only be measured if a strain gauge records the elongation of the specimen (permanent elongation including elastic component) up to break.
- Uniform elongation Ag
The standardised tensile specimen stretches evenly in the parallel area of the cross-section. A standardised tensile specimen usually has a dumbbell shape (bone shape). The uniform elongation Ag is the elongation of this specimen from radius to radius up to the maximum force.
- Total uniform elongation Agt
Like Ag - but including the elastic part (the elastic part contracts again after breaking)
Material without pronounced yield strength

This material is either an iron material that has undergone further treatment (cold forming, heat treatment, etc.) or a steel (iron with an additional alloy). With these materials, the yield strength known from iron is no longer present or alloyed steel and other metals (aluminium, bronze, etc.) have no yield strength. The material is continuously elongated during a tensile test without a spontaneous drop in force (drop in stress) occurring. A permanent elongation (damage) of the material is therefore not as obviously recognisable as in the first diagram. An equivalent yield point - the yield strength - was therefore defined in the standardisation as a way of determining the first damage. This involves observing the force or stress at which the material leaves its elasticity and is permanently deformed (stretched). An extension of 0.2 % permanent elongation was generally defined as a standard of comparison.
Hookesche Straight
Robert Hook discovered that every body exhibits elastic behaviour. If a body is extended by a length that is not too great, it contracts again. This is most obvious with rubber or a spring.
Modulus of elasticity
The modulus of elasticity is the calculation of the material characteristic value of the material elasticity value discovered by Hook. The easiest way to explain this function is as the spring constant of the material. If a spring is pulled apart, a certain force per mm must be used to extend the spring. For example, you need 100 N (approx. 10 kg) to lengthen the spring by 1 mm. The spring constant C = 100 N /mm. The modulus of elasticity is calculated in a similar way. However, the forces are replaced by stresses and the lengths by elongations. The nominal modulus of elasticity of a material such as steel (e.g. 210,000 MPa depending on the alloy) results from the following theoretical calculation: If the initial length L0 could be doubled without the steel being permanently elongated (damaged) (without the curve tilting horizontally), the material would reach a stress of 210,000 MPa. This is certainly not possible because any steel would be plastically deformed for a long time and would certainly also break if it were lengthened by 100 %. But the modulus of elasticity is only a theoretical figure. It ultimately expresses the steepness of Hooke's straight line (theoretical graph) - the red line in the diagram. The modulus of elasticity must be determined in order to be able to apply an offset of 0.2 % (or other) to this straight line so that the stress can then be tapped at the intersection of these parallel lines.
Yield strength Rp0.2
Stress value that is determined as soon as the sample has been permanently elongated by 0.2%. For this purpose, a straight line is formed parallel to the modulus of elasticity. The stress at 0.2 % elongation is tapped at the point of intersection with the graph.
Yield strength Rp0.01
Like Rp0.2 but with 0.01 % elongation. This is the smallest usual yield strength and is used for static calculations in mechanical engineering, for example. A structure may only be loaded to such an extent that it is never permanently deformed. Therefore, an even smaller characteristic value of the permanent deformation is of interest for the static calculation. For evaluation, a straight line is formed parallel to the modulus of elasticity. The stress at 0.01 % strain is tapped at the point of intersection with the graph.
Yield strength Rp1.0
This proof stress is less common. It corresponds to the stress at a permanent elongation of the specimen by 1.0% elongation.
Comparability of elongation at break
In common parlance, elongation refers to experiences and observations in our daily lives. As we can only observe this phenomenon on very elastic, highly ductile materials, this term is associated with an extension that refers to materials such as rubber. The observation leads us to believe that all areas of the (rubber) tensile specimen elongate evenly until it breaks. It is theoretically possible to subject a parallel strip or round bar to a tensile load and measure the same elongation at every point at any time during the tensile test (uniform elongation until break).
- Rubber remains completely elastic until it breaks and - as long as it is not torn - contracts completely to its original length.
Metal behaves differently: once a damage threshold has been exceeded, a permanent elongation occurs (even if no damage / necking is visible). As soon as the sample has been lengthened by 1 mm, for example, this lengthening only contracts by 0.3 mm - 0.7 mm lengthening remains.
- Initially, a steel sample actually elongates uniformly at all points (of a homogeneous cross-section) (uniform elongation). However, this behaviour changes dramatically. As soon as all structural components have been elongated to the maximum, further flow occurs only partially. Where the fracture occurs later, the material flows disproportionately and constriction occurs (waist formation). Flow behaviour (elongation) occurs in the area of the later fracture, whereas other areas are no longer elongated.
- Elongation depends on the cross-section or volume:
This is clearly illustrated by the example of balloons:
A small balloon can only be inflated slightly until it bursts.
A large balloon can be inflated to a correspondingly larger size.
Steel: A sample with a large cross-section has more material inside to flow than a small cross-section. Therefore, a sample with a large cross-section (with the same sample or initial length) can be extended higher than a sample with a small cross-section:
A round rod Ø 10 mm can be extended from 100 mm to 120 mm.
A round rod Ø 20 mm can be extended from 100 mm to 125 mm (+ 5 mm).
In order to make the elongation at break comparable, a system had to be integrated into the elongation calculation to take the different volume into account. As metal flows proportionally in relation to the volume (more volume = higher elongation), this law was included. The reference length Lo (length zero) is therefore always recalculated in relation to the cross-section by including the proportionality factor. So the test is not carried out with a fixed Lo but the zero length (Lo ) is calculated taking the proportionality factor K into account:
Lo = K x (root So)
K = proportionality factor 5.65
So = sample cross-section in mm²
Calculation of the Lo (initial length)
Round sample Ø 10 mm: Lo = 5.65 x (root(10 x 10 x 3.14 /4)) = ~ 50.06 ~ 50 mm
Round sample Ø 12 mm: Lo = 5.65 x (root(12 x 12 x 3.14 /4)) = ~ 60.07 ~ 60 mm
In addition to the proportionality factor K 5.65, there is also the less common factor 11.3.
A probe arm extensometer or long-travel extensometer simplifies the testing and evaluation of the elongation at break: It contacts the sample with its cutting edges at exactly this dimension (50.0 mm or other, non-rounded numbers) and tracks this initial measuring length (Lo) up to the break. The calculation can then be carried out in a simple manner as only the measured values of the probe arm extensometer are included in the measurement.
If no (cost-intensive) long-travel extensometer is used, the sample must be marked before the test at a grid spacing of 5 mm or with centre punch points (which do not provoke premature breakage at this point). After breakage, the fragments are placed together and the extended initial gauge length is measured.
Special features for thin sheets
If sheets are too thin, no material can flow out of the thickness: The sample does not stretch proportionally to the cross-section. For sheet metal less than 3 mm thick, the elongation is therefore determined on a "non-proportional flat specimen" with a rigid reference length. For iron and steel sheet, the elongation is calculated on the basis of an initial length Lo of 80 mm (A80 elongation). For non-ferrous metals, the elongation is calculated on the basis of a Lo of 50 mm (A50 elongation).
Elongation can't compared one to one
If the result of the elongation at break does not contain an index (i.e. only capital letter A), a flow behaviour proportional to the volume must be assumed. In this case, the elongation at break is A(5.65).
If the flow behaviour is NOT PROPORTIONAL, an index must be added to the elongation value: It is a non-proportional flat specimen A80 or A50 (or the proportional flow behaviour A11.3).
If you want to compare strains, you must (if necessary) add an index. If the elongation of different samples is to be compared, these must be converted. There are calculation formulas for this or we have created a website that converts the elongation into other types of elongation.
Calculation of elongation at break (representation: sample elongation in mm)

The diagram shows why the elongation at break cannot be measured via the crosshead travel: The elongation values result from a total of 3 areas:
- Elastic strain (figures 0.05 mm), are deducted at the end as the sample contracts by this part after fracture
- Plastic strain in the entire parallel area Lc (uniform strain Ag to Fm)
- yield strain in the area of the necking - elongation only occurs in the yield area
Only the figures in the Lo area may be included in the elongation at break calculation!
Calculation of elongation at break
From our experience, we know that calculating the elongation (flow behaviour) of metals / a tensile specimen is the most difficult parameter to explain. Metals have a special feature when it comes to elongation. Every one of us has observed how metal is brought into a permanent deformation: If you bend a metal sheet just a little, it springs back into its original shape (elasticity behaviour). However, if you bend it further and further, at some point the point is reached at which this piece of metal remains bent: It is permanently deformed. Similar to the elastic/plastic bending of a steel, it also behaves under tensile load. If this steel is only slightly elongated, it contracts again (similar to rubber). Only when the damage limit is exceeded does the steel elongate permanently. For certain tasks in industry, it is important to precisely determine the elongation behaviour of a metal. Because only if you know the exact forming behaviour (ductility) can you ensure that the metal can be formed into the desired shape without causing too much damage (premature breakage). This becomes logical when you realise that a cooking pot is created from a flat sheet metal plate through extreme forming - a deep-drawing process with extreme elongation.
However, metal does not stretch evenly at all points until it breaks. As soon as the uniform elongation at the maximum force is exceeded, the material flows more and more extremely at the weakest point (and only there), constricts (waist formation) and breaks there. As the flow behaviour of the metal is not the same at all points, a systematic approach must be found to determine the elongation in a comparable way. For this reason, the elongation A (elongation at break) is related exclusively to a precisely defined but variable distance. This reference dimension (length zero - L0 for short) is used as the basis for the calculation and calculated using the formula.
Note: The elongation cannot be directly compared with each other. An elongation A (A5.65) differs considerably from an elongation A80 / A11.3 / A50 / A100 / A200. To compare the elongations, they can be converted.
A - Elongation at break (in %)
L0 - Initial measuring length of the sample (initial length)
Lu - Length after the break (includes initial gauge length L0 and the extension of this part)
Formula for calculating the elongation at break A for a tensile test
(Note: If the short letter A is used without an index, it is the extension A5.65)
Formula: A = ((Lu – L0)/L0)x 100 resp:

Definition of tensile testing for metals
| Abbreviation | Unit | Designation / simplified declaration |
| a0 | mm | Initial thickness of a flat specimen or wall thickness of a pipe at the start of the tensile test |
| b0 | mm | Width of a flat specimen in the test length | average width of a tube strip specimen | profile wire at the start of the tensile test |
| D0 | mm | Outer diameter of a pipe |
| L0 | mm | Initial gauge length (reference length or initial length for the elongation) |
| LC | mm | Test length (parallel part of the measuring length between the radii) |
| Lt | mm | Total length of the sample including heads |
| LU | mm | Gauge length after break (L0 stretched) |
| S0 | mm² | Initial cross-section of the sample: thickness x width | diameter | tube diameter x wall thickness | weight method: weight / length / density |
| SU | mm² | Smallest cross-section after fracture (to calculate the necking - flow behaviour / strain behaviour in the cross-section) |
| K | - | Proportionality factor - ratio of the cross-section to L0 (5.65 or 11.3) |
| Z | % | Fracture constriction - ratio between S0 and SU ( calculation of the constriction - flow behaviour / expansion behaviour in the cross-section |
| R (σ) | MPa | Stress - force divided by the initial sample cross-section |
| A | % | Elongation at break - elongation of the sample in relation to the initial gauge length L0 (without index = elongation A5.65) Note: Elongation values are not directly comparable - please use our calculator for conversion. |
| At | % | wie A, jedoch beinhaltet dieser Wert auch die (totale) Dehnung inkl. elastischer Anteil |
| Ag | % | Uniform elongation: The elongation of metals occurs up to the force maximum (Fm force maximum) or stress maximum (Rm) uniformly over the entire parallel area Lc / LV of the sample. From this point onwards, elongation only occurs in the area of the necking. The uniform elongation is a very important statement for formability (especially in deep drawing) in order to decide which elongation can be demanded of a material (forming a cooking pot from a disc). The uniform elongation can only be determined with a long travel extensometer which remains on the sample until Ag (Rm) and beyond. The elongation value Ag does not include elastic elongation - this is deducted (in contrast to Agt). |
| Agt | % | as Ag, but this value includes the elastic elongation |
| A5,65 | % | Typical proportionality factor for calculating the L0 (not applicable for flat samples thickness <3.0 mm | wires Ø <4mm) Note: Strain values are not directly comparable, please use our calculator for conversion. |
| A11,3 | % | Proportionality factor for calculating the L0 (not applicable for flat tensile specimens thickness <3.0 mm wires Ø <4 mm) Note: Strain values are not directly comparable, please use our calculator for conversion |
| A50 | % | Elongation at break of flat tensile specimens made of sheet metal with a thickness of 0.1 - 3.0 mm (most common specimen form for non-ferrous metals such as aluminium, copper etc. for measuring the non-proportional elongation of samples under <3.0 mm thickness. Note: Strain values are not directly comparable, please use our calculator for conversion. |
| A80 | % | Elongation at break of flat tensile specimens made of sheet metal with a thickness of 0.1 - 3.0 mm (most common specimen form for steel flat tensile specimens for measuring, among other things, the non-proportional elongation. If only a small amount of material is available, specimen form the specimen shape A50 can also be selected. Note: Strain values are not directly comparable, please use our calculator for conversion. |
| A100 A200 | % | Elongation at break of wires: Wires often break at an undefined point. If one were to measure an A5.65 elongation the elongation / break often occurs outside the cutting edges of the extensometer. You therefore set the L0 and the cutting edge distance to 100 or 200 mm and thus determine the strain A100 / A200. At this distance, there is a high chance that the break will occur within the cutting edges. Note: Elongation values are not directly comparable, please use our calculator for conversion. |
Test report (test certificate)
| Reproduction of the content of ISO 6892-1 in relation to a test report (see also below: PDF download test report) ISO 6892-1 from 2017-02 stipulates that the test report must contain the following information (exception: the parties agree otherwise) | |
| 1. Reference to the ISO 6892 standard and the testing speeds - herer: A224 | A2XX = 0.00025 mm/mm/second (closed loop - refered to knife distancde extensometer) AX2X = 0.00025 mm/mm/second (open loop - refered to parllel lenght from radius to radius - crosshead movement) AXX4 = 0.0067 mm/mm/Sekunde (open loop - refered to parllel lenght from radius to radius - crosshead movement) |
| 2. Identification of the sample | Sample number for traceability |
| 3. Material, if known | ST370 - Structural steel |
| 4. Type of sample | Flat sample |
| 5. Sample position and direction | Removal: 50 mm from the belt edge. Cross test |
| 6. Control types of the test and test speeds | only if deviating, see also 1. |
| 7. Test results | Reh, Rp0.2, Rm, Ag, A80 (E-modulus is NOT a result according to ISO6892-1 but serves as a good result of the tests) Values rounded R values without decimal place to nearest whole number A-values with rounding to 0.5% Z-fracture constriction rounded to 1% (if relevant) |

Interested? Enquire now without obligation!